 English
FC Spider
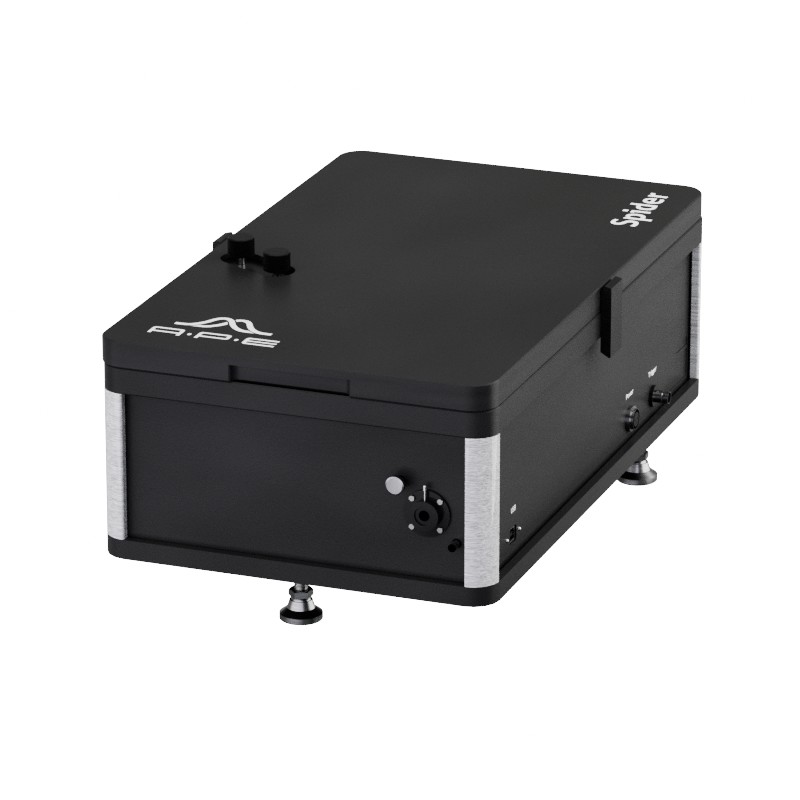
Precise Characterization of Few-Cycle Pulses Down to < 5 fs
Overview
The FC Spider (Few Cycle Spider) by APE provides spectral and temporal characterization of ultrashort laser pulses down to below 5 fs. It covers the visible, the near-infrared as wellas the infrared spectral region. This high-precision tool is ideal for aligning and monitoring the performance of broadband Ti:Sa oscillators and amplifier chains.
Measuring Spectral Phase Directly
Based on the proven and patented Spider (Spectral Phase Interferometry for Direct Electric-field Reconstruction) technology, using a non-drifting, etalon interferometer and a material dispersion stretcher, the FC Spider directly measures the spectral phase by analyzing a spectral interferogram. In combination with a simultaneously measured power spectrum, real-time calculation and visualization of the spectral and temporal amplitude and phase is accomplished.
At a Glance
- Short pulse characterization down to < 5 fs
- Spectral coverage in the IR range and VIS range
- Real-time and single-shot measurement of phase and intensity
- High level of automated software support and internal camera-assisted alignment
- Full software suite included
- Ideal for broadband Ti:Sa oscillators, hollow-core fiber compressors, and NOPA
Few Cycle Spider Wavelengths and Bandwidths
FC Spider VIS
FC Spider NIR
FC Spider IR
500 nm … 700 nm | ~800 nm | ~1030 nm |
5 nm … 100 nm | 25 nm … 200 nm | 50 nm … 300 nm |
7 fs … 75 fs | <5 fs … 40 fs | 5 fs … 30 fs |
single shot: <20 Hz | single shot: <20 Hz | >100 Hz |
FC Spider Customized
Curious to see if a custom FC Spider with your special parameters is possible? Please contact us.
E.g. for NOPA
E.g. for Ti:Sa Compressor
E.g. for fs-Yb Compressor
Software Suite
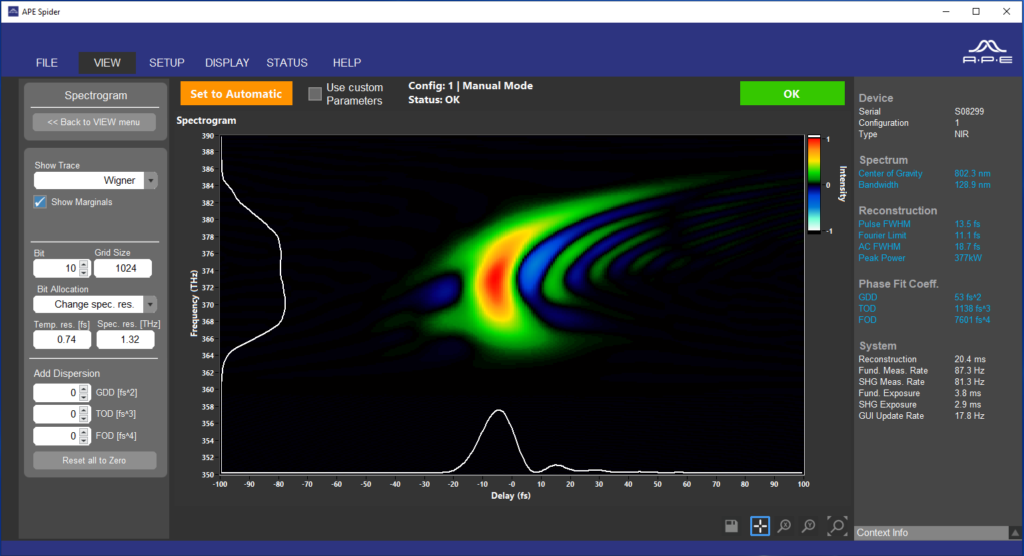
Powerful Spider Software Package
- Spectral and temporal reconstruction based on Spectral Phase Interferometry for Direct Electric-field Reconstruction
- E-field plot
- Peak power calculation
- Measurement of phase differences
- Spectral phase analysis up to fourth order
- Simulation of additional theoretical dispersion (GDD, TOD, FOD)
- Spectrogram (X-FROG, SHG-FROG) and Wigner trace representation of the pulse
- Parameter logging
- TCP/IP interface for automated read out and remote access
Specifications
| FC Spider | VIS | NIR | IR |
| Center wavelength | ~500 nm ~600 nm ~700 nm | ~800 nm | ~1030 nm |
| Spectral bandwidth | 5 nm … 50 nm for ~500 nm 10 nm … 80 nm for ~600 nm 20 nm … 100 nm for ~700 nm | 25 nm … 200 nm | 50 nm … 200 nm Optional: 50 nm … 300 nm |
| Transform limited pulse width | 8 fs … 75 fs for ~500 nm 7 fs … 50 fs for ~600 nm 7 fs … 35 fs for ~700 nm | <5 fs … 40 fs | 7 fs … 30 fs Optional: 5 fs … 30 fs |
| Max. pulse width (chirped) | 120 fs | 200 fs | 200 fs |
| Laser repetition rate | Any, single shot <20 Hz | >100 Hz | |
| Trigger | TTL, for laser repetition rate <20 Hz | TTL, for laser repetition rate 100 Hz ... 10 kHz | |
| Interface | USB 2.0 | ||
| Software | Full Spider software suite included | ||
| Input requirements: | |||
| Laser pulse energies | 0.2 nJ … 8 nJ for MHz repetition rates <10 µJ for kHz repetition rates ~10 µJ for Hz repetition rates / single shot |
||
| Polarization | Linear, horizontal | ||
| Beam diameter | <5 mm | ||
| Beam height | 72 mm … 106 mm (spectral phase and internsity) | ||
| Options: | |||
| Wavelength | Others on request, please ask | ||
| External beam splitter and beam routing kit | On request, please ask | ||
| Notebook | On request, please ask With pre-installed Spider software |
||
Datasheets & Brochures
or
Email & Phone Contacts
APE has distributors around the world to give you the best support. Choose a country to find your local sales contact: