 English

Spider
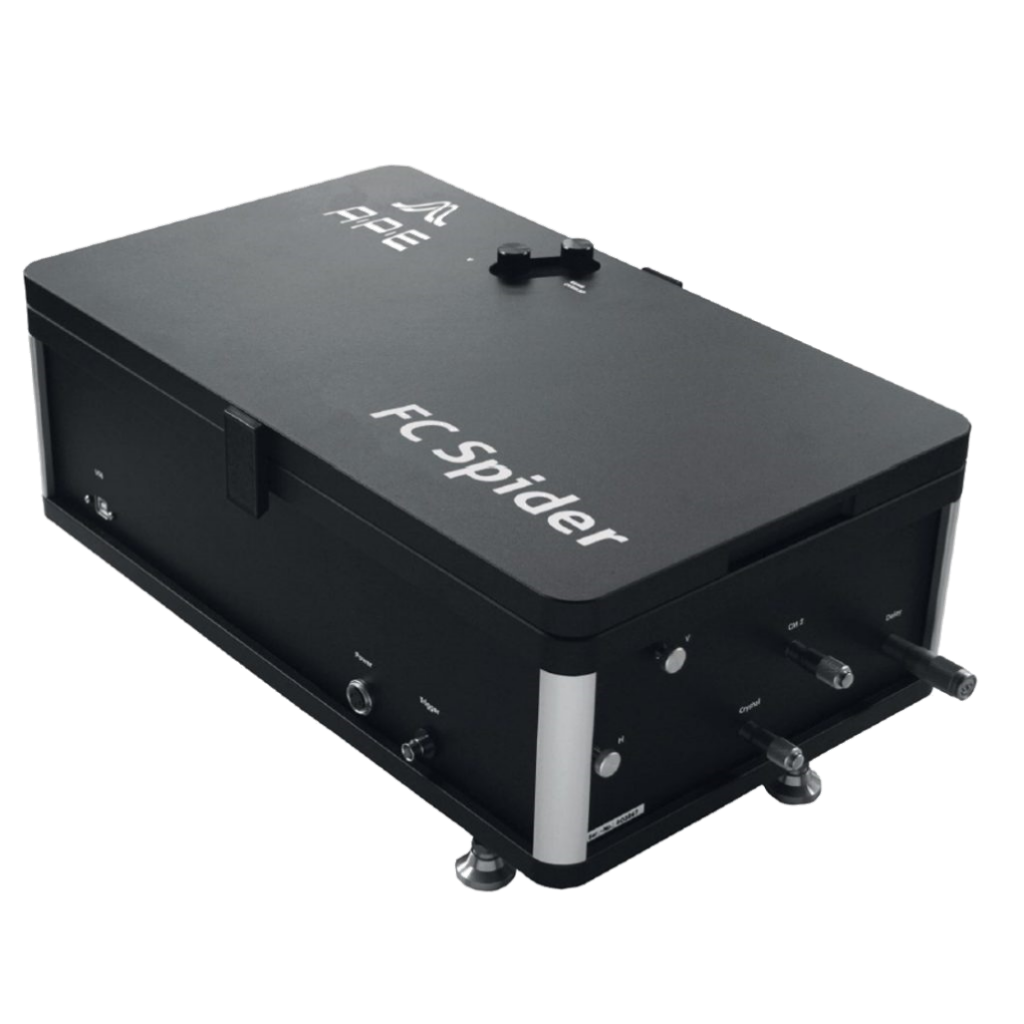
Laser Pulse Characterization with Spectral Phase Interferometry for Direct Electric-field Reconstruction
Spider Family
Our Spider – Spectral Phase Interferometry for Direct Electric-field Reconstruction – family is designed for phase resolved ultrafast pulse measurements. FC (Few Cycle) Spider offers a precision tool for the complete characterization of ultrashort laser pulses with just a few electric field cycles — sub 5 fs pulse width. For less broadband pulses Spider with grating stretcher is the best choice for pulses between 15 fs and 500 fs at ~ 0.8 µm or 1 µm central wavelength.
Software Features
Important software features for advanced pulse characterization are provided with all APE Spiders. If desired, a notebook with pre-installed software can be delivered optionally together with the instrument.
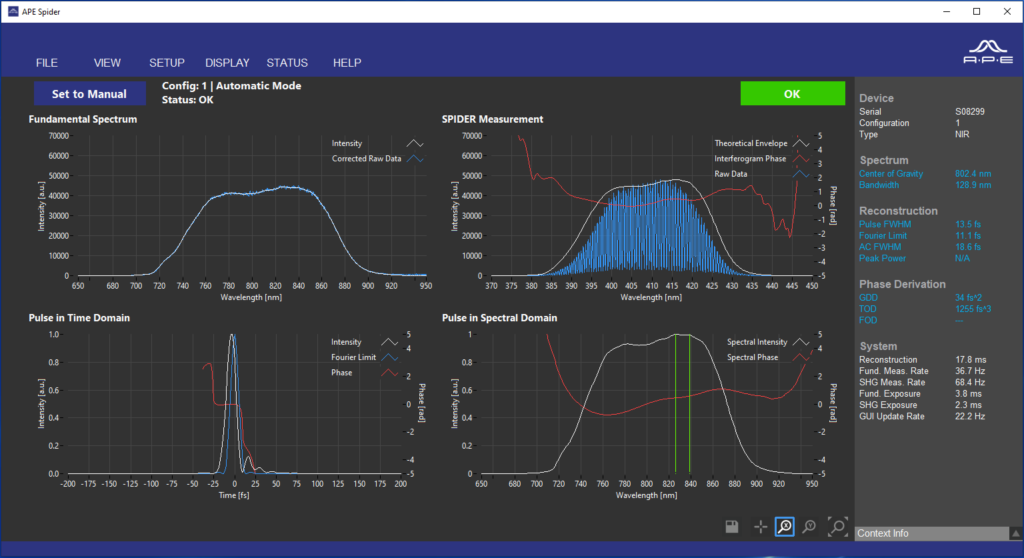
Spider & FC Spider Software Features
- Spectral and temporal reconstruction based on Spectral Phase Interferometry for Direct Electric-field Reconstruction
- E-field plot
- Peak power calculation
- Measurement of phase differences
- Spectral phase analysis up to fourth order
- Simulation of additional theoretical dispersion (GDD, TOD, FOD)
- Spectrogram (X-FROG, SHG-FROG) and Wigner trace representation of the pulse
- Parameter logging
- TCP/IP interface for automated read out and remote access
A comparison of Spectral Phase Interferometry for Direct Electric-field Reconstruction (SPIDER) with Frequency-resolved Optical Gating (FROG).
In comparison to FROG, Spider offers some differences. The following table gives some aspects that could be considered.
Spider
- Direct measurement in the spectral domain (amplitude and phase)
- Intrinsically single shot
- Insensitive to intensity noise
- Fast and direct reconstruction mathematics
- Unambiguous in the sign of the chirp and time
- Relatively complex setup
- Different parameter ranges often require an optimized single-setup
(SHG) FROG
- Relatively simple optical setup
- Direct sampling in the time domain
- Highly variable for different parameter ranges (pulse duration, wavelength)
- Iterative fitting algorithm may make data interpretation more complex
- Measure spectrally broadband pulses in single shot often not possible
The Spider Family made by APE
or
Email & Phone Contacts
APE has distributors around the world to give you the best support. Choose a country to find your local sales contact: