 English
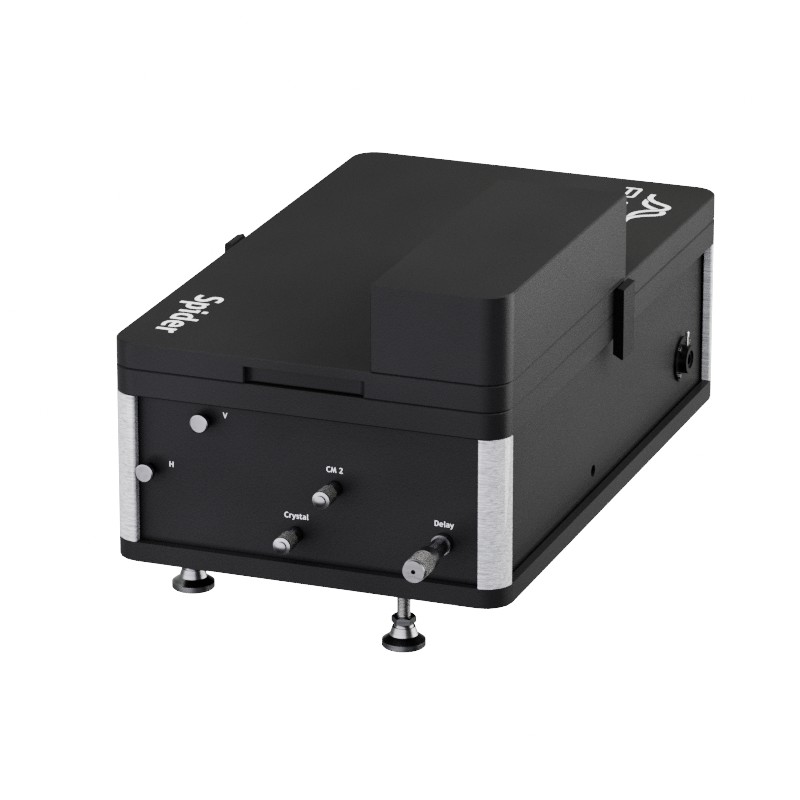
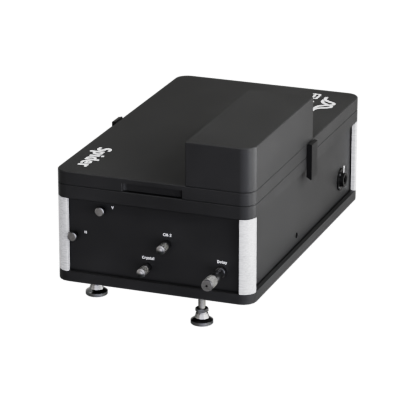
Spider
Characterization for Small Bandwidths and Longer Pulses at NIR or IR Wavelengths
Overview
The Spider is a precision tool optimized for the complete spectral and temporal characterization of laser pulses in the infrared or near infrared. Based on the patented Spider technology, it extends the existing range of APE Spider models to cover longer pulses, between 15 fs and 500 fs, at central wavelengths around ~ 0.8 µm or 1 µm. It also supports detection of the chirp sign for stretched pulses greater than 2 ps width, making it a smart choice for the alignment of pulse compressors.
True Single Shot
With its two internal spectrometers (for fundamental spectrum and upconverted interferogram) the Spider is able to simultaneously measure amplitude and phase of the same pulse. This gives it true Single shot capability. Furthermore, the Spider control software supports calculation of the temporal intensity and phase with video rate.
At a Glance
- Best choice for pulses between 15 fs and 500 fs at ~ 0.8 µm or 1 µm
- Spectral intensity and phase measurement plus temporal intensity and phase calcualtion
- Real-time measurement and reconstruction of intensity and phase
- Single shot measurement for low repetition rate laser sources
- High level of automated software support and internal camera-assisted alignment
- Full software suite included
Software Suite
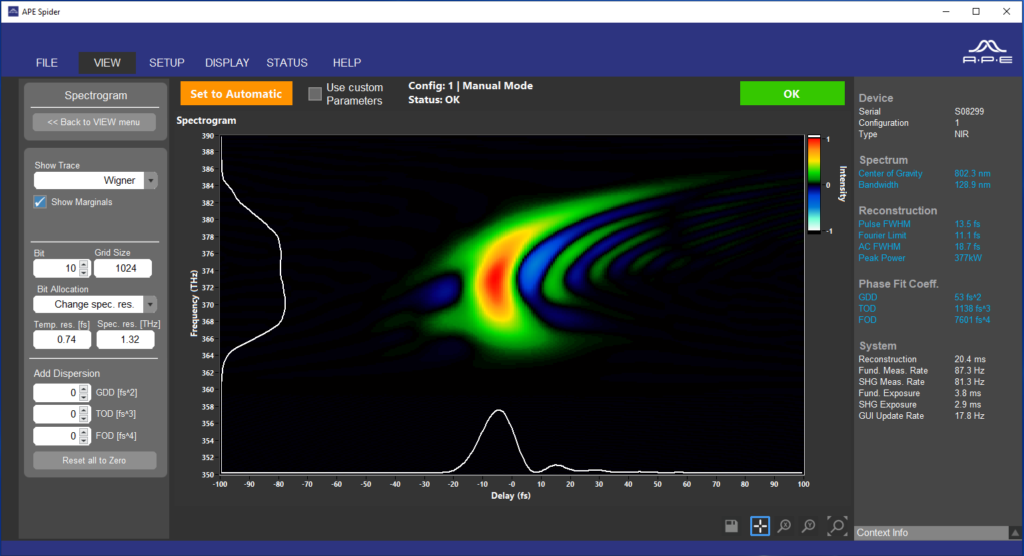
Powerful Spider Software Package
- Spectral and temporal reconstruction based on Spectral Phase Interferometry for Direct Electric-field Reconstruction
- E-field plot
- Peak power calculation
- Measurement of phase differences
- Spectral phase analysis up to fourth order
- Simulation of additional theoretical dispersion (GDD, TOD, FOD)
- Spectrogram (X-FROG, SHG-FROG) and Wigner trace representation of the pulse
- Parameter logging
- TCP/IP interface for automated read out and remote access
Specifications
| Spider | NIR | IR |
|---|---|---|
| Center wavelength | 750 nm … 900 nm | 970 nm … 1070 nm |
| Spectral bandwidth | 15 nm … 60 nm | 7 nm … 50 nm |
| Transform limited pulse width | 15 fs … 60 fs | 30 fs … 200 fs |
| Max. pulse width (chirped) | 200 fs | 500 fs |
| Laser repetition rate | Any, single shot (<20 Hz) | |
| Trigger for single shot measurements | TTL, for laser repetition rate <20 Hz | |
| Interface | USB 2.0 | |
| Software | Full Spider software suite included | |
| Input requirements: | ||
| Laser pulse energies | 0.2 nJ … 8 nJ for MHz repetition rates <10 µJ for kHz repetition rates ~10 µJ for Hz repetition rates / single shot |
|
| Polarization | Linear, horizontal | |
| Beam diameter | <5 mm | |
| Beam height | 72 mm … 106 mm (spectral phase and intensity) 87 mm … 121 mm (spectral intensity) |
|
| Options: | ||
| Wavelength | Others on request, please ask | |
| External beam splitter and beam routing kit | On request, please ask | |
| Notebook | On request, please ask With pre-installed Spider software |
|
Datasheets & Brochures
or
Email & Phone Contacts
APE has distributors around the world to give you the best support. Choose a country to find your local sales contact: