 English
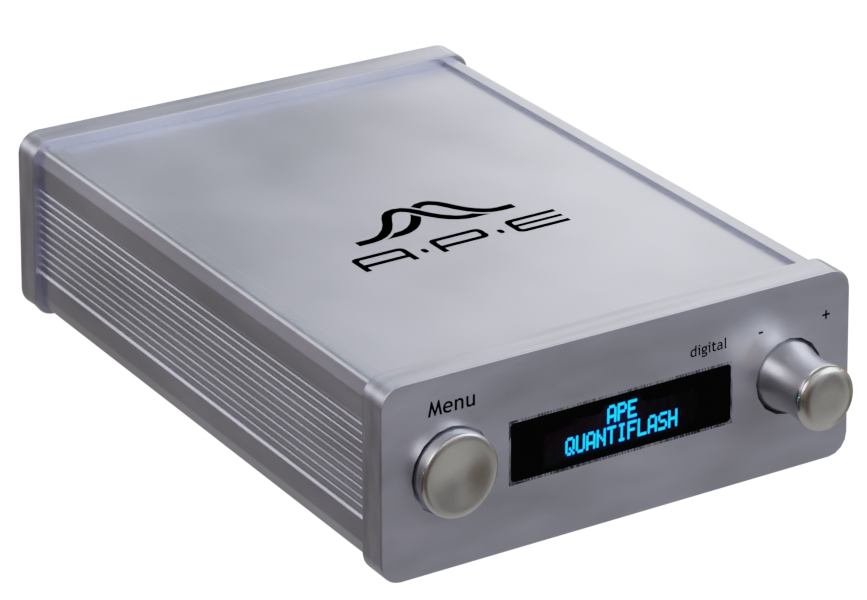
Pulsed Calibration Light Source for Cytometers
- Improved LED design achieves intensity linearity accuracy below 1%
- TCP/IP and scripting interface for remote control always included
- New advanced pulse feature option available*
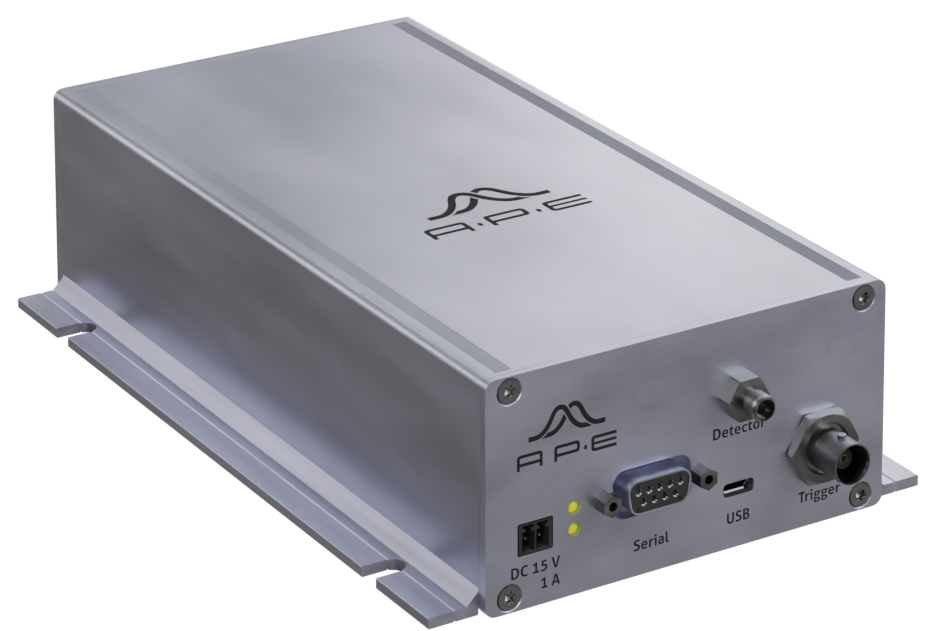
- External trigger input possible via TTL
* Including custom pulse shape design, long pulse function up to 100 µs, external triggering and manual control of most settings.
Overview
quantiFlash® is an ideal tool to obtain the best resolution and sensitivity of cytometers. Unlike calibration beads, quantiFlash delivers consistent and uniform light pulses. Their intensity and duration is freely adjustable.
Perfect Light Pulses
Perfect light pulses with almost no unwanted non-liniearities outperform bead-based calibration particles. A precise LED pulser light source is the ideal tool for monitoring and calibration in flow cytometry.
Standard Protocols
Use standard calibration protocols or develop your own.
Performance Test of PMTs
Performance tracking in long-term or inter-laboratory studies as well as comparability of instruments become available with the quantiFlash LED pulser. The proven perfect linearity of quantiFlash and the delivered light intensity within up to 6 decades allow the measurement and comparison of the dynamic range and the signal-to-noise ratio of PMTs.
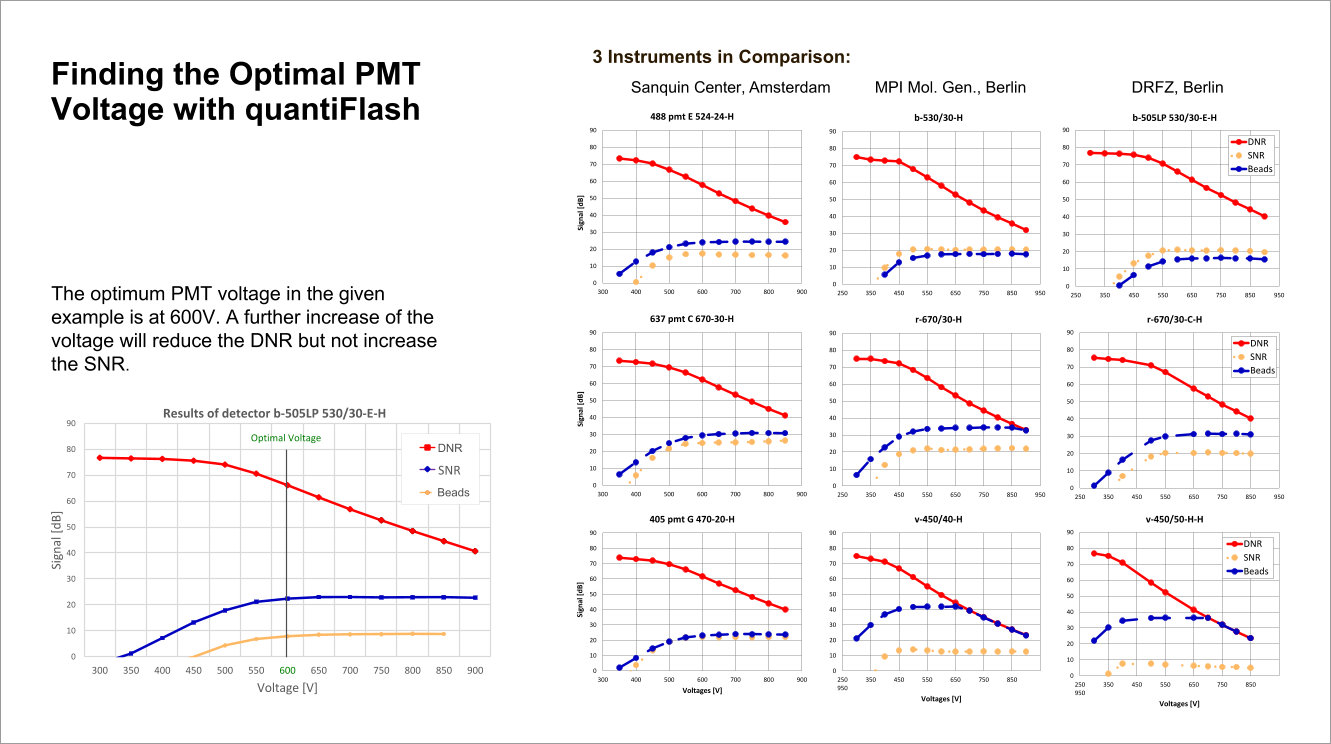
The optimal PMT voltage for the cytometer detector channels can be found based on the results obainted with quantiFlash.
Performance Tracking & Result Comparison
quantiFlash enables user to determine the resolution and sensitivity (reflected by Q and B) for each detector so that instrument comparison as well as long-term experiments become more efficient.
Specifications
| Specifications | ||
|---|---|---|
| Pulse Duration | up to 100 µs available |
|
| Events (Repetition Rate) | ||
| Repetition Rate Precision | ||
| Pulse Shape | ||
| Pulse Amplitude | ||
| Amplitude Precision | ||
| Trigger | ||
| Fiber Coupling | ||
| Dimensions and Power | ||
| Dimensions | ||
| Power | power supply unit; USB supply | |
| Features and Options | ||
| Advanced Pulse Feature | - Custom pulse-shape design - Long-pulse function up to 100 µs - External trigger support - Manual control of most settings |
|
| Options | ||
Datasheets & Brochures
APE quantiFlash Calibration Light Source Cytometry Rev.4.0.0 – Brochure (pdf / english)
Product Guides
quantiFlash_Getting_Started_Rev 2.0 (pdf / english)
quantiFlash_Mounting_Instruction_Rev 2.0 (pdf / english)
Software
quantiFlash Software 1.6.85 (without Python)
Measurement Scripting Interface
Thank you for using quantiFlash! Measurement scripts are now available with the latest Pro software. This gives users the ability to make data acquisition and analysis much faster and easier.
The following features are included:
– Calibration constant channels –> NPE
– Characterization of background for each channel
– Characterization of SNR
– Characterization of DNR
– Linearity range of the detectors
The scripting interface software can be downloaded here:
Download Software quantiFlash Portable 1.6.85 (Portable Python included)
Requirements
– A quantiFlash
– Pro license for your quantiFlash. This is necessary because the scripts use the ability to remotely control quantiFlash.
– The scripts are compatible with Python 3.7. The zip file contains all necessary packages as well as the latest version of the Python scripts. As portable software it can be copied to a Windows PC (Windows 7 or higher) without installation.
Comments
– A user manual is included in the zip file
– It is recommended to use the flow cell adapter kit supplied by APE. It helps to connect the quantiFlash fiber outputs to BD flow cytometers.
– If you have an older version of quantiFlash, the software may request you to update the firmware. Please contact service@ape-berlin.de to check if this firmware upgrade can be performed on site or if a recalibration of your instrument is necessary.
– For any other problems related to the quantiFlash, please also contact service@ape-berlin.de
or
Email & Phone Contacts
APE Angewandte Physik & Elektronik GmbH
Plauener Strasse 163-165 | Haus N
13053 Berlin, Germany
tel +49 30 98601130
fax +49 30 986011333
Sales: sales@ape-berlin.de
Support: service@ape-berlin.de
quantiFlash Mounting Kit for BD available
quantiFlash Flow Cell Adapter for BD
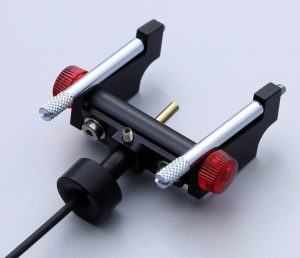
quantiFlash comes with 2 fibers. The fiber ends have to be interfaced with the flow cytometer or to phrase it differently: 2 fibers = 2 points of connection of quantiFlash with the flow cytometer. For this our adapter can be easily mounted on BD instruments with access to the flow cell.
These are for example:
- FACSymphony
- LSR II
- FACSAria
- FACSCanto
- FACSCalibur
- LSRFortessa
Applications
Calibrate Intensity Scales to Absolute Units
• Ultra-stable light pulses allow for direct calibration of intensity channels to a standardized photonic scale
• Easy calculation of the corresponding number of detected statistical photoelectrons (Spe) for any intensity channel
Accurate Q and B Measurement
• Calculate values for detection efficiency (Q) and background (B) in terms of statistical photoelectron units (Spe) or fluorescence intensity units, such as mean equivalent soluble fluorescence units (MESF) or an equivalent number of reference fluorophores (ERF)
• Accurately compare different cytometers or setups
Performance Test of PMTs
• Use the proven perfect linearity of quantiFlash to check the performance of your PMTs and signal processing
• Precise adjustment of the delivered light intensity within up to 6 decades
Recommended Literature
Cyto 2020 (virtual) Contribution: Comparison study of flow cytometers combining novel ultra-bright calibration particles with state-of-the-art characterization methods
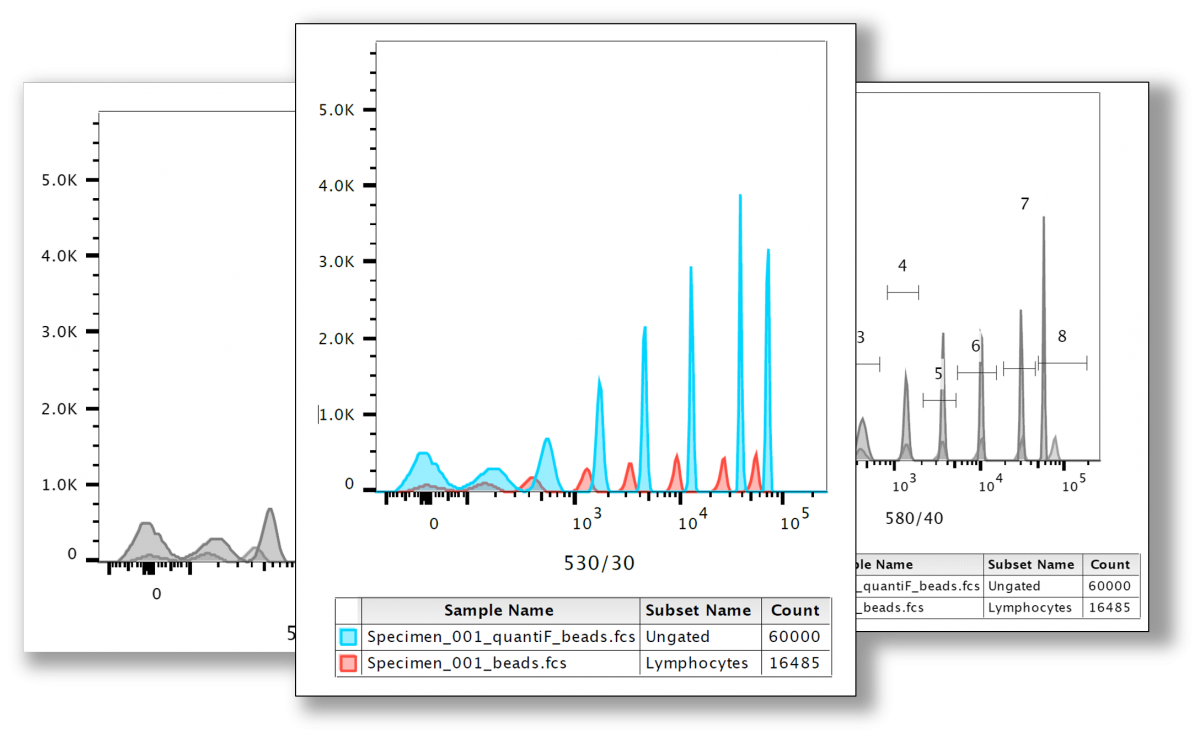
The combination of quantiFlash and bead-based methods gives a whole new perspective on cytometer performance and characteristics. The results have been presented at Cyto 2020 (virtual) and are available as download here: Flow cytometer characterization combining beads and quantiFlash – Poster Cyto 2020
Automated cytometer characterization using calibration particles in combination with quantiFlash
The possibility to characterize both the detector performance as well as the overall excitation and detection efficiency of a particle of interest is explained in this poster, which has been presented at Cyto 2019. Available for download here: quantiFlash-for-Cytometer-Calibration-Poster Cyto2019.
Evaluating flow cytometer performance with weighted quadratic least squares analysis of LED and multi-level bead data
The authors Parks, Brinkman and colleagues developed a fully automated procedure for analyzing data from LED pulses and multi-level bead sets to evaluate backgrounds and photoelectron scales of cytometer fluorescence channels. Available from Cytometry A at https://www.ncbi.nlm.nih.gov/pmc/articles/PMC5483398/
Flow cytometric detection and sorting of EVs: analysis and characterization of background noise sources that may impact EV fluorescence or scatter detection.
Robert Sleiman, Beckman Coulter, used quantiFlash to look on both optical and electronic noise sources that may impact EV detection, characterization and sorting. http://acs2016.m.acs.currinda.com/schedule/session/5734/abstract/24046
A must-read: Standardization, Calibration, and Control in Flow Cytometry (Wang & Hoffmann)
Probably the best overview of flow cytometry calibration has been written by Lili Wang (NIST) and Robert A. Hoffman (Independent consultant). A must-read for scientists and developers working in all areas of cytometry! Available from Wiley/NIST at https://www.nist.gov/publications/standardization-calibration-and-control-flow-cytometry
One-page Overview: Photonic calibration, determination of background, signal-to-noise and dynamic range of a flow cytometer
Here we describe how quantiFlash is used to characterize a cytometer’s PMT performance and the instrument’s response over the entire PMT voltage range. The one-pager is available for download here.
Determination of background, signal-to-noise, and dynamic range of a flow cytometer: A novel practical method for instrument characterization and standardization
A well-defined scale calibration in flow cytometry can improve many aspects of data acquisition such as cytometer setup, instrument comparison and sample comparison. We employ a practical method to characterize a cytometer’s signal-to-noise ratio (SNR) and dynamic range (DNR). This allows the selection of a voltage/gain corresponding to a PMT’s maximum efficiency. The full paper is available at http://onlinelibrary.wiley.com/doi/10.1002/cyto.a.23250/pdf
Technical Note: Multispectral flow cytometry: The consequences of increased light collection
We use Q (detection efficiency) and B (background) values and develop a novel “multivariate population overlap factor” to characterize the cytometer performance. To verify the usefulness of our factor, we perform representative experiments and compare our overlap factor to Q and B. Finally, we conclude that the increased light collection of multispectral flow cytometry does indeed lead to increased sensitivity, an improved detection limit, and a higher resolution. The full technical note is available at http://onlinelibrary.wiley.com/doi/10.1002/cyto.a.22888/epdf
Forensic Flow Cytometry presented by NIH
Pratip Chattopadhyay, Staff Scientist at National Institutes of Health, presented a Forensic Flow Cytometry Tutorial at the CYTO2015 Conference. The full presenation is available at http://de.slideshare.net/PratipChattopadhyay/cyto-2015-forensic-flow-tutorial
Quantitative comparison study of flow cytometers using a novel ultra-stable calibration light source
In this talk we discuss ways to quantify flow cytometers in terms of sensitivity and resolution. As shown by others, the coefficient of variation (CV) of a stable light source can be used for scale calibration in numbers of detected photoelectrons. This calibration allows the quantitative comparison of flow cytometers in terms of light detection efficiency. The full presenation is available for download here: Calibration and Comparison Study with quantiFlash.
Comparison study of various flow cytometers presented by DRFZ
Comparison study of various flow cytometers using quantiFlash. Traditionally, flow cytometers are characterized (sensitivity, linearity, long time stability etc.) by fluorescent microspheres. As shown by others*) the coefficient of variation (CV) of a stable light source can be used for scale calibration in numbers of estimated photoelectrons. This allows the quantitative comparison of flow cytometers in terms of light detection efficiency. Due to the intrinsic CV (2-4%) of microspheres they are not suitable for such calibration. Here we show a comparison of the detection efficiency of 3 flow cytometers (FACSAria™) using quantiFlash™. quantiFlash™ is an ultra-stable (CV < 0.1%) easy to use LED pulse generator made for cytometer characterization. The poster has been presented at CYTO 2016, Seattle. This poster is available for download.
Isolation and characterization of Extracellular Vesicles presented by Beckman Coulter
Flow cytometric detection and sorting of EVs: analysis and characterization of background noise sources that may impact EV fluorescence or scatter detection by Dr. Carley D. Ross, Dr. Thomas Ramin, Dr. Aliaksandr Kachynski
Beckman Coulter Life Sciences, Cellular and Molecular Life Sciences 2011; 68(16):2667-88. The full presentation is available at https://prezi.com/loogalklhahr/isolation-and-characterization-of-extracellular-vesicles/